Environmental
Understand your operational footprint.
- Emissions and energy consumption
- Water, waste and resource use
- Reduction targets and progress

JINGYAN · DIGITAL SOLUTIONS
Sustainability Platform
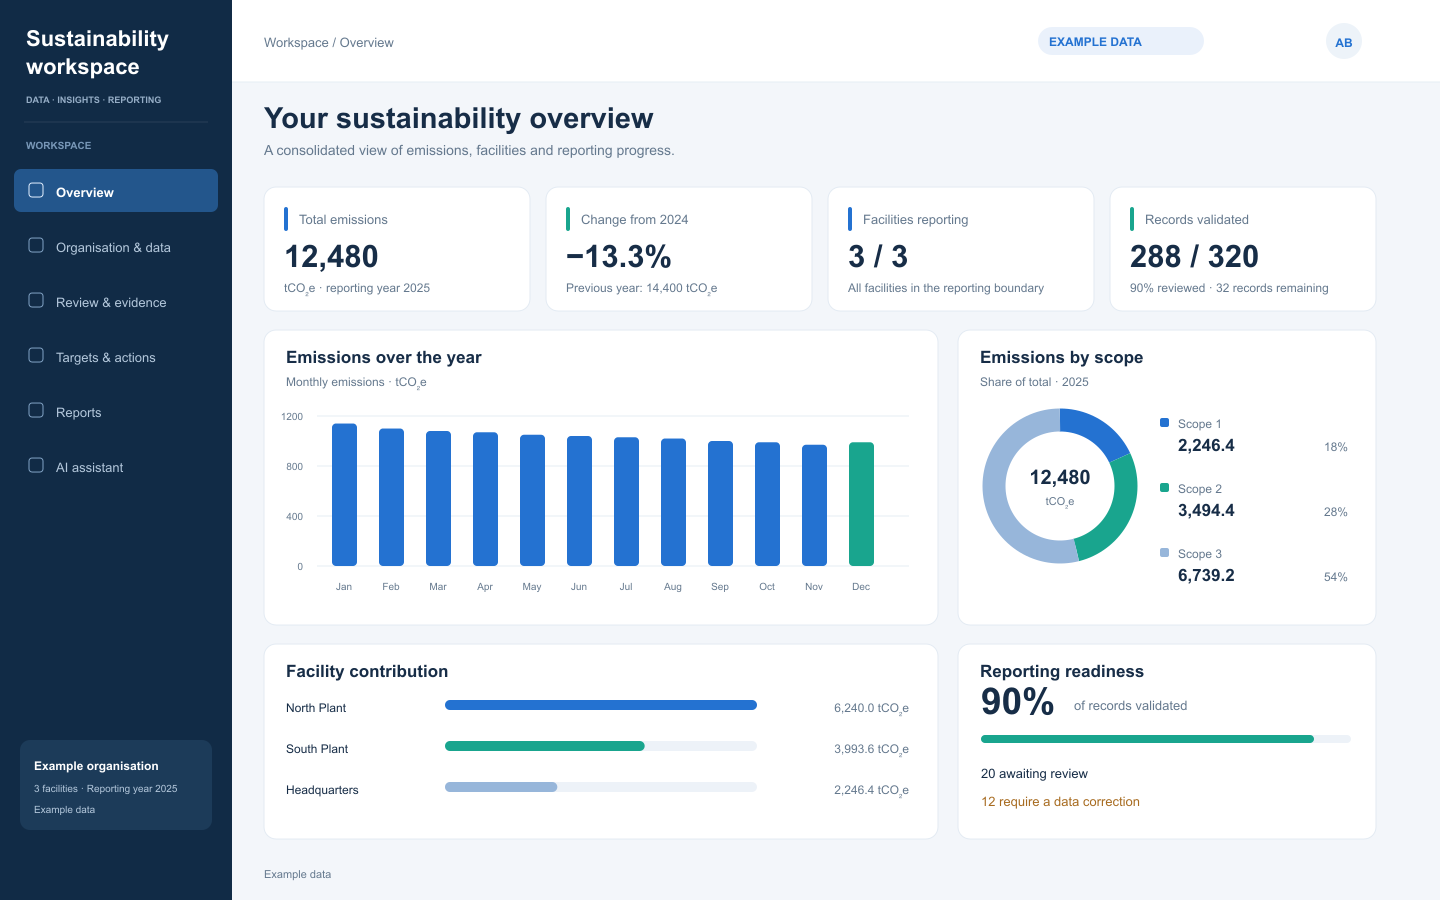
Bring your sustainability data, emissions analysis and reporting into one connected workspace. Move from scattered records to clear, evidence-backed decisions.
ONE PLATFORM. A CONNECTED VIEW.
Support the people who collect the data, review the evidence and turn results into action.
Understand emissions across your organisation, compare facilities and plan reductions against a shared baseline.
Explore carbon intelligence ↗Organise environmental, social and governance information with clear ownership, evidence and review steps.
Explore reporting ↗Ask questions about your data, investigate trends and prepare summaries with supporting records close at hand.
Meet the AI assistant ↗A BROADER VIEW OF PERFORMANCE
Give sustainability information a consistent structure, from operational indicators to the people and policies behind them.
Understand your operational footprint.
Organise the data behind social impact.
Connect policies with accountability.
FROM SOURCE DATA TO DECISIONS
Collect. Measure. Review. Plan. Report. Ask.
01 / COLLECT
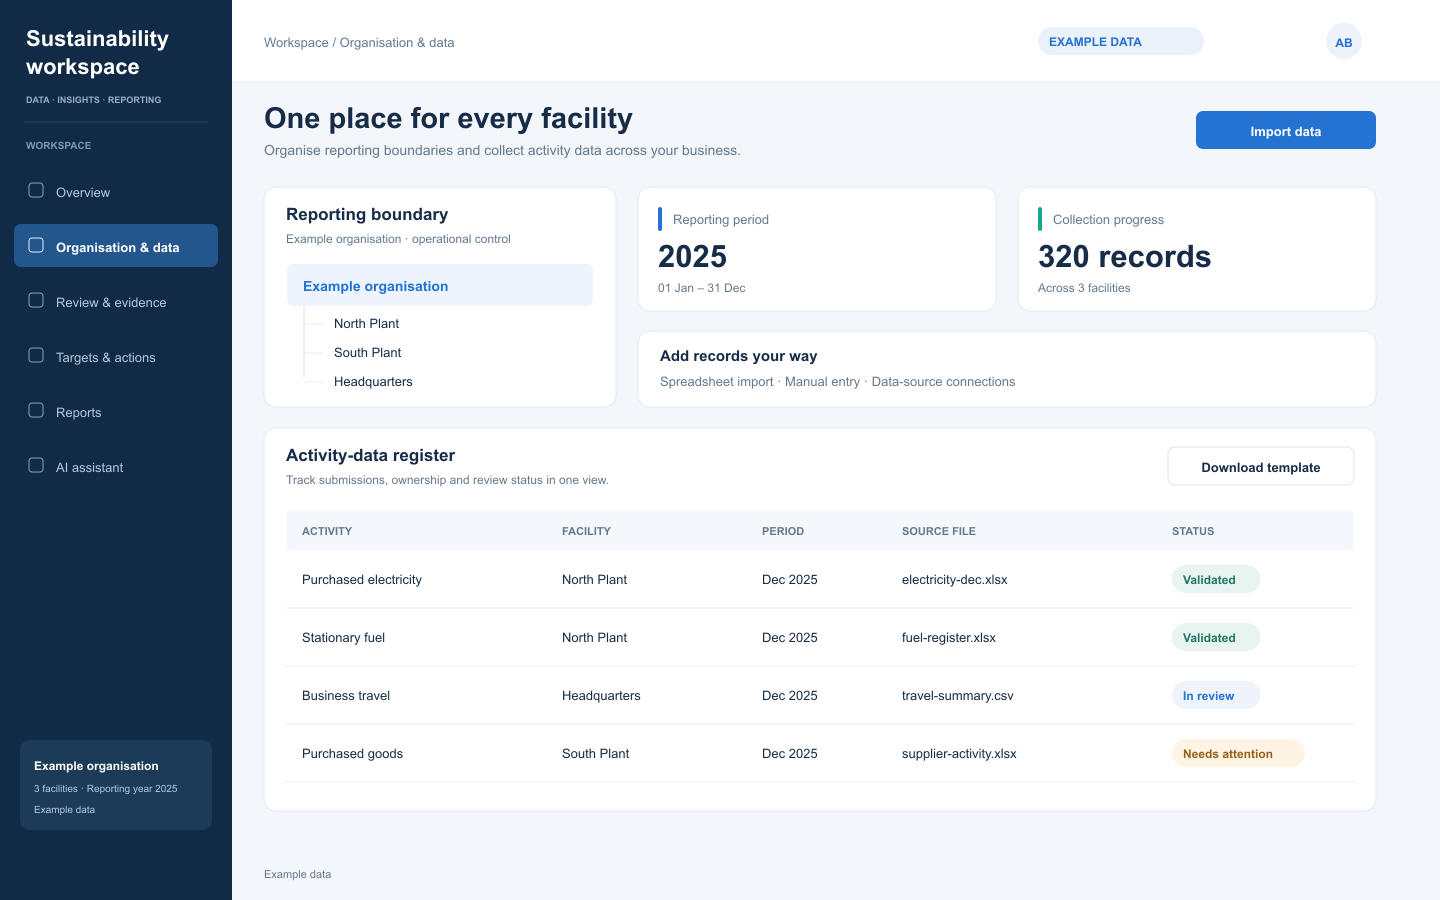
Define facilities, assign responsibility and gather activity data in a consistent structure. Keep each team’s contribution connected to the wider reporting picture.
02 / MEASURE
Turn activity records into a view of Scope 1, 2 and 3 emissions. Compare facilities and periods to understand the sources that matter most.
03 / REVIEW
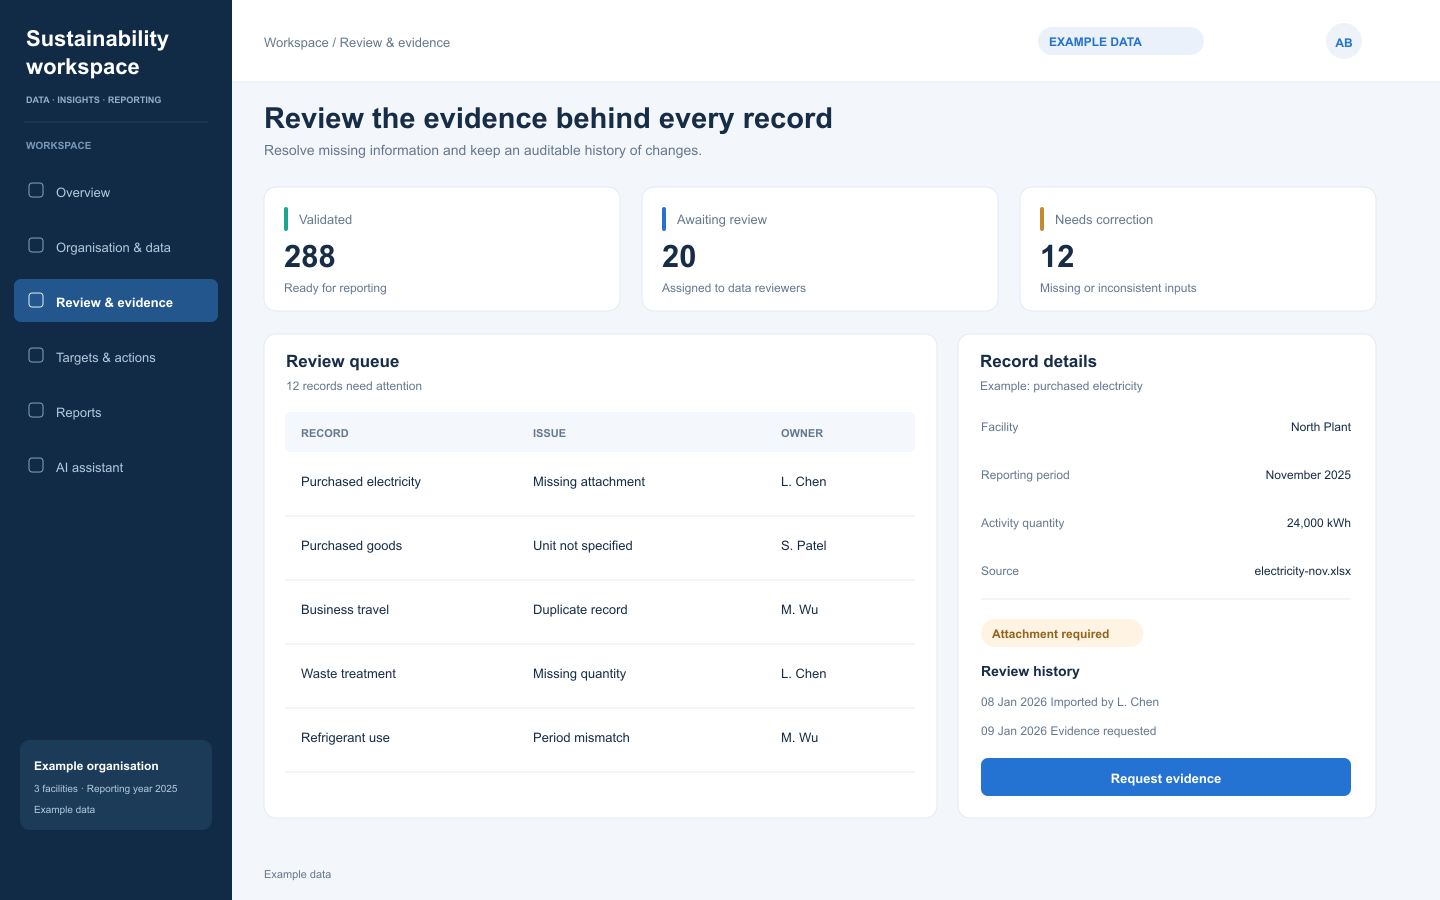
Bring source documents, validation issues and review decisions into the same workflow. Follow a figure back to the record behind it.
04 / PLAN
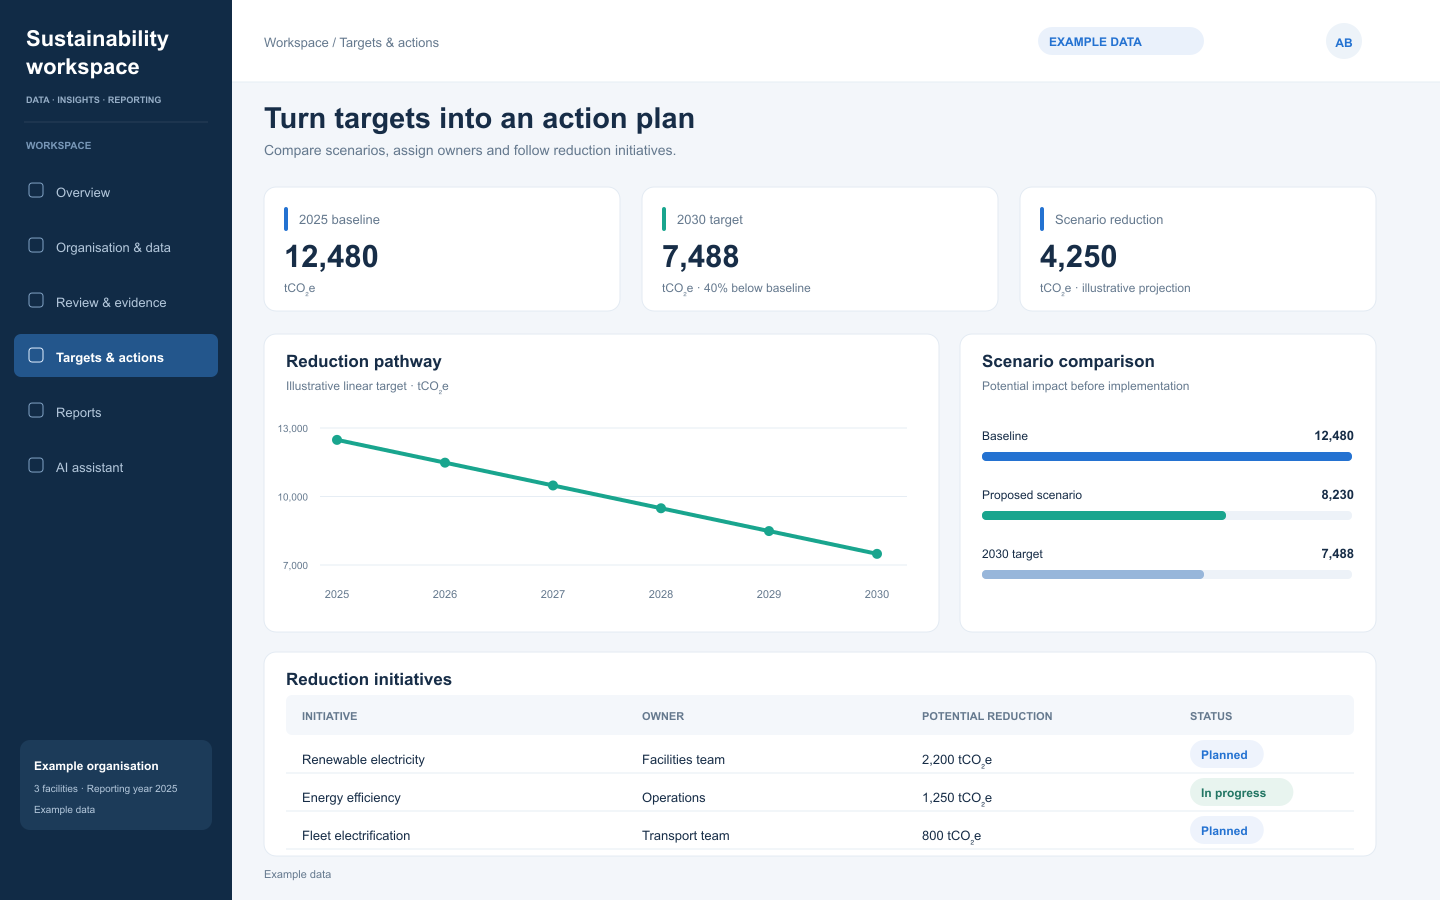
Set a direction for emissions reduction and compare the initiatives that could help you get there. Keep targets, scenarios and responsibilities visible.
05 / REPORT
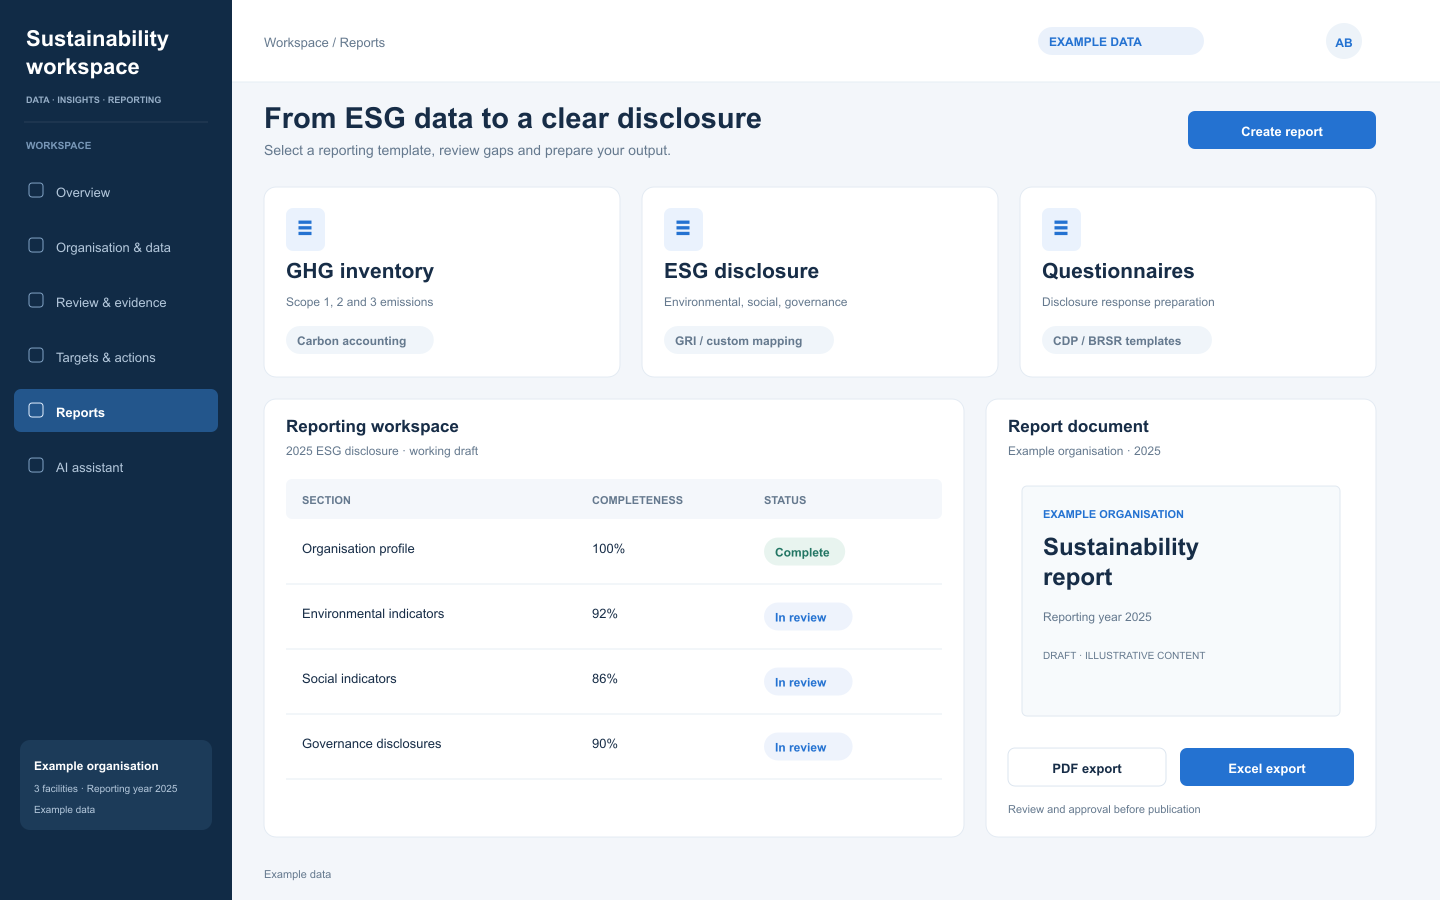
Bring environmental, social and governance information into a structured reporting workspace. Review gaps, organise supporting records and prepare outputs for stakeholders.
06 / SUSTAINABILITY INTELLIGENCE
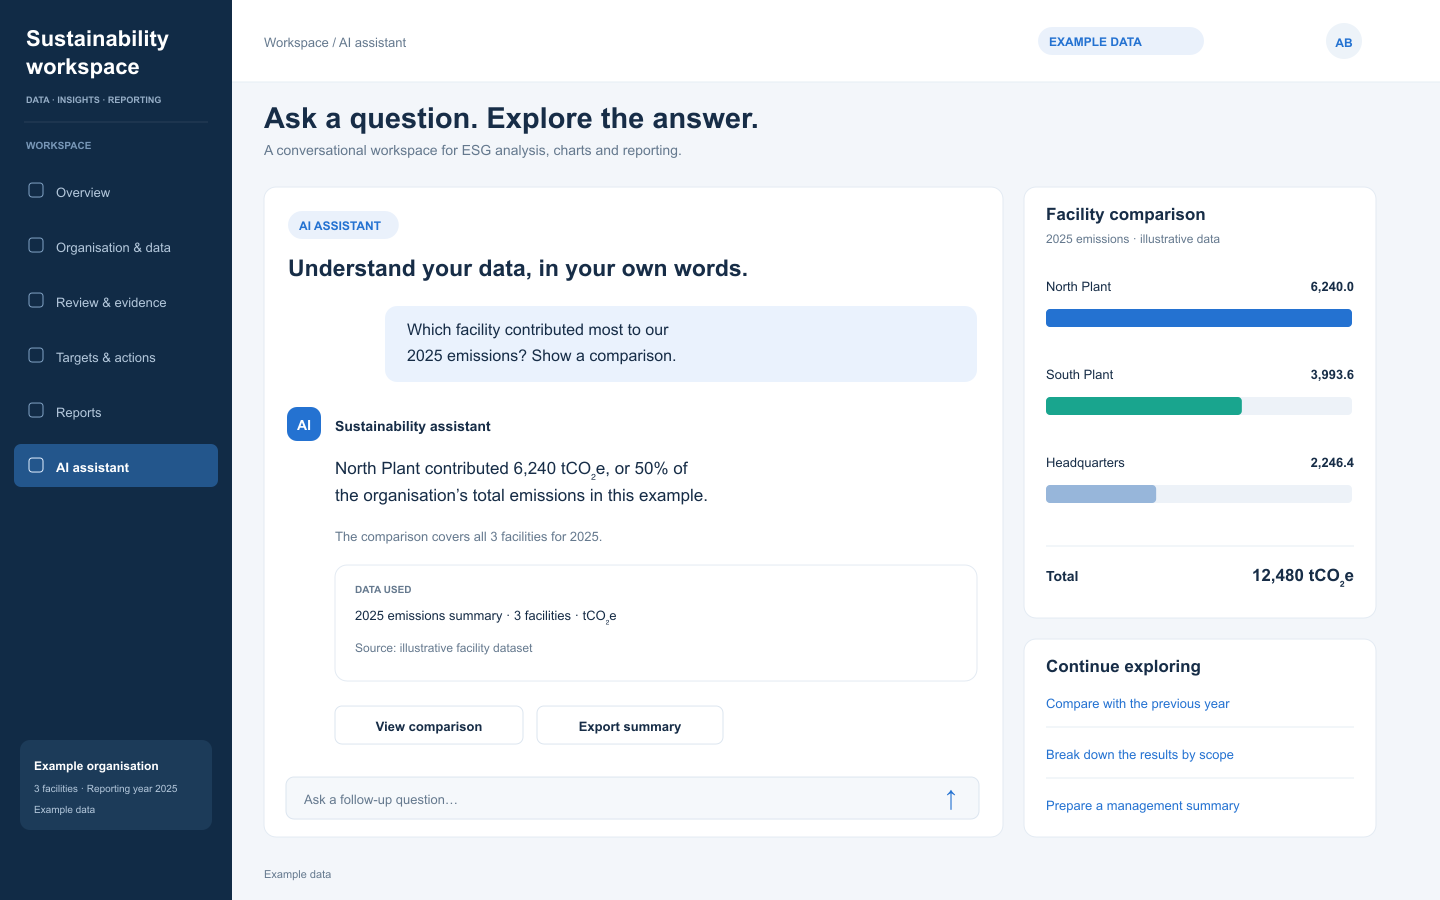
Explore sustainability information in everyday language. Compare facilities, investigate changes and build a concise explanation with the underlying records in view.
BUILT FOR THE WORK BEHIND THE REPORT
Bring facility records and reporting information together in a consistent workspace.
Keep evidence, ownership and validation status alongside the data they explain.
Connect your baseline, planned actions and reporting milestones across teams.
Use comparisons and source-linked analysis to make results easier to review.
PLANNING YOUR SOLUTION
We’ll discuss your data, reporting priorities and approval process to define a suitable scope.
Your organisation and facility structure, current spreadsheets or data sources, reporting periods, required frameworks and the teams involved in review.
The workflow brings facility-level submissions into a consolidated view, with comparisons across locations and reporting periods. We’ll discuss the boundaries and responsibilities that fit your organisation.
We start with the disclosures and audiences you need to support, then agree the template mapping, data fields and review process for your project.
It helps users explore comparisons, trends and summaries with supporting records. Your team reviews the context and evidence before using an answer in a decision or disclosure.
YOUR NEXT REPORT STARTS WITH BETTER-CONNECTED DATA
Tell us about your organisation, your reporting needs and where you want to go next.
Talk to Jingyan